Advanced Internet Mapping System User's Guide
Advanced Internet Mapping System User's Guide
Tools
Identify features, get community information, view Google Street View images, draw graphics or text on the map, measure or get coordinates on the map, and export map layers.
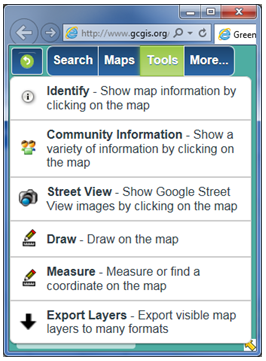
Identify - The Identify tool displays descriptive information for a specified map feature. Map features must be visible in the map view to be identified.
Community Information - Assembles information describing the "Community" surrounding a specified location on the map.
Street View - View Google Street View images of a location by clicking on the map within 150 feet of a street in the desired location.
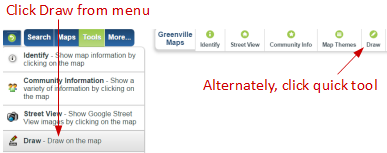
Draw - Provides the option to draw graphics and enter text on the map.
Measure - Provides the ability to measure Area, Length, and display Longitude and Latitude coordinates.
Export Layers - Export and download visible data layers within the current map extent (view) as a compressed (.zip) file.
The Identify tool displays descriptive information for a specified map feature. Map features must be visible in the map view to be identified.
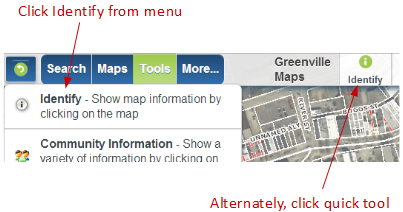
Click on the desired feature in the map view to identify.
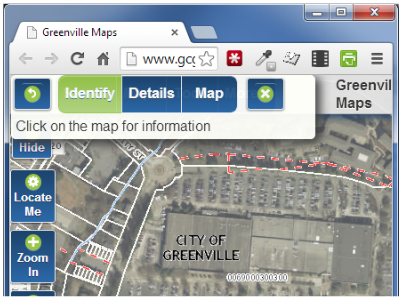
If identifying a feature in a map theme that returns more than one result, an option to toggle between identified layers will be provided.
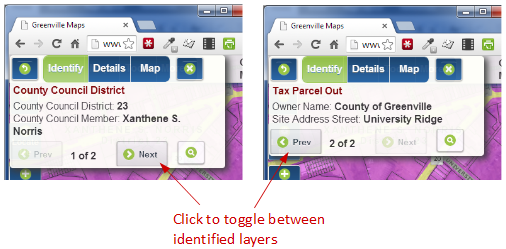
Descriptive details will be returned with the option to zoom to the identified feature.
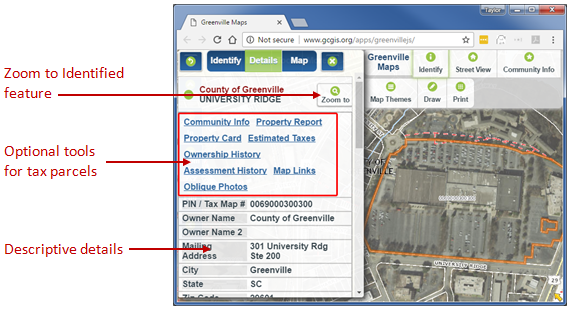
Optional tools are applicable only to the Tax Parcel layer. These tools, which include: Community Info, Property Report, Property Card, Estimated Taxes, Ownership History, Assessment History, Map Links, and Oblique Photos are described in detail on the Search page, under the Tax Parcel Search Example.
The Community Information tool assembles information describing the "Community" surrounding a specified location on the map. It is described in detail on the Search page, under the Tax Parcel Search Example.
The Street View tool allows for viewing Google Street View images for an area of interest.
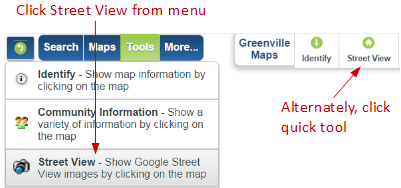
Browse to an area of interest and click the Street View tool from the Tools menu or from the quick tools toolbar.
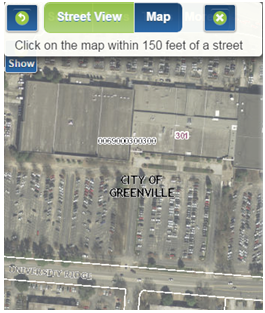
Click on the map within 150 feet of a street where Street View images are desired.
A window will pop up showing Street View images and the location of the area in Google Maps
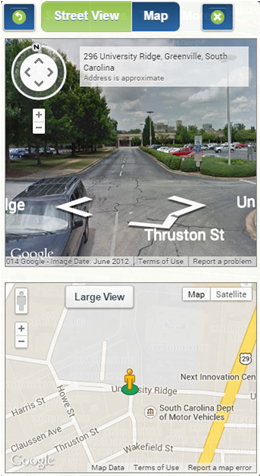
Navigate in Street View:
- To move around, click the white arrows on the bottom of the screen. You can also move your cursor in the direction you want to travel. Your cursor becomes a white oval that decreases in size the further you want to move.
- To look around, click and drag your mouse. You can also use the arrows on the compass.
- To zoom in or out, scroll with your mouse or two-finger zoom with a touchpad. You can also use the + and - buttons below the compass.
Optionally, you can click the Large View button to open the Street View image in a new tab and the Satellite button to view satellite images in the Google Map. When viewing satellite images in the Google Map, you have the option to toggle labels and 45o oblique imagery.
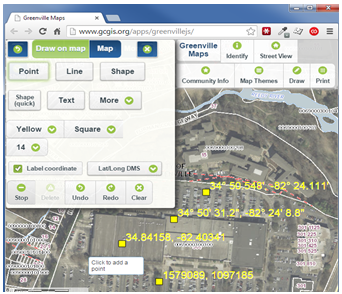
The Draw tool provides the option to draw graphics and enter text on the map.
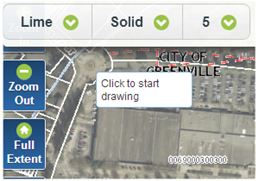
To draw graphics or text on the map, choose the graphic type to draw, and then select the options for that graphic. Tool tips will appear on the map indicating the action to take to draw a particular graphic or text.
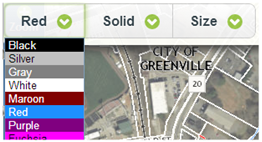
- Click the Red dropdown to choose the Point color.

- Click the Circle dropdown to choose the Point shape.
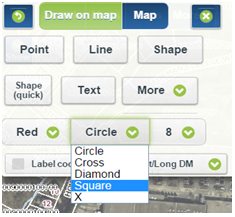
- Click the 8 dropdown to choose the Point size.
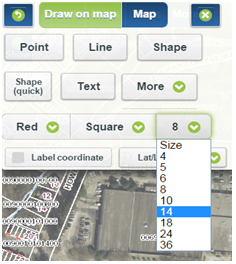
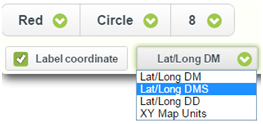
- An option to label the Point with coordinates is available by checking Label coordinate in the menu and clicking the
Lat/Long DM dropdown to choose between Degrees Minutes, Degrees Minutes Seconds, and Decimal Degrees for
Latitude/Longitude coordinates and XY Map Units for South Carolina State Plane coordinates.
- Click the desired spot in the map view for the Point to be drawn.
Once a graphic is drawn on the map, options to Undo, Redo, Clear, and Stop drawing will be available.
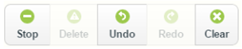
- Undo will remove the last graphic placed on the map.
- Redo will add back the last graphic that was previously removed using the undo tool.
- Clear will delete all graphics on the map.
- Stop will deactivate the Draw tools so that the map can be clicked on without adding new graphics.
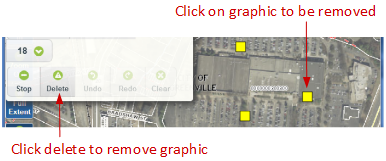
Individual graphics can be removed from the map, without clearing all graphics, by selecting the desired graphic and then clicking Delete.
- Click on the graphic to be removed and the Delete button will become active.
- Click the Delete button in the menu to remove the graphic.
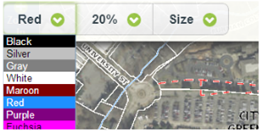
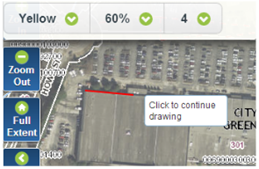
- Click the Red dropdown to choose the Line color.
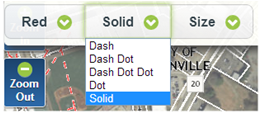
- Click the Solid dropdown to choose the Line design.
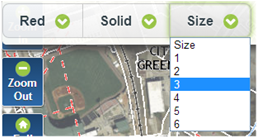
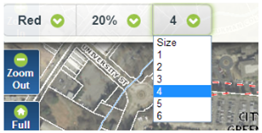
- Click the Size dropdown to choose the Line width.
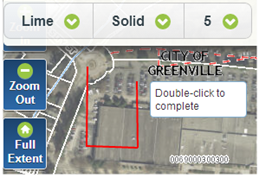
- Click once in the map view to start the Line.
- Click again to change Line direction.
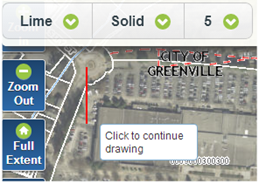
- Double click when ready to complete the Line drawing.
- Click the Red dropdown to choose the Shape color.
- Click the 20% dropdown to choose the percentage of opacity desired for the Shape. The higher the number, the less
transparent the fill color will be.

- Click the Size dropdown to choose the Shape line width.
- Click once in the map to start the Shape.

- Click again to add a new vertex to the Shape.
- Double click when ready to complete the Shape.

Draws a freehand polygon on the map.
- Click Red, 20%, and Size to choose the color, opacity, and line width of the Shape.
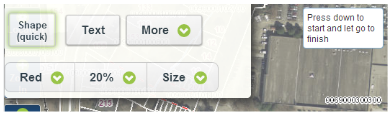
- Click on the map and hold to start the Shape. Move the mouse while holding the left button to construct the Shape. Let go to finish the Shape.

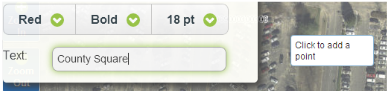
- Click the Red dropdown to choose the Text color.
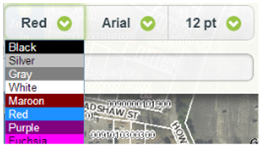
- Click the Arial dropdown to choose the Text font.
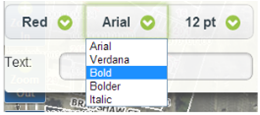
- Click the 12pt dropdown to choose the font size.
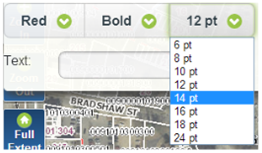
- Type text in the text box and then click on the map where you want the Text placed.
Contains more graphical elements to draw on the map. These shapes include arrow, circle, ellipse, line-quick (freehand line), rectangle, and triangle.
- Click the More dropdown to choose a graphical element.
- Click Red, 20%, and Size to choose the color, opacity, and line width of the Shape.
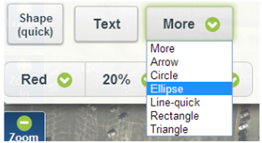
- Click the map once to add the default size of the graphical element or click and drag to increase the size or change the direction of the element.
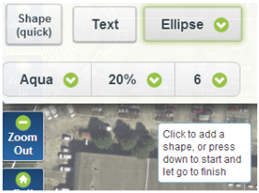
Note: For the Line-quick element: click, hold, and drag to create the line. Let go to finish the line.
The Measure tool provides the ability to measure an Area or Length, display Longitude/Latitude coordinates, and Zoom to Longitude/Latitude or State Plane coordinates.
An option to label all measurements is included for each measurement tool and is on by default. Uncheck the green check box to measure without labels.

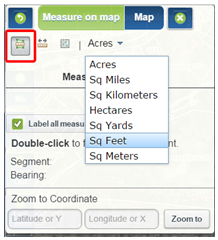
- Select the Area icon and click Acres to choose the desired unit of measure from the dropdown menu.
- Left click once on the map to start the measurement and left click once for every change in direction. The length and bearing of the current segment
are displayed in the dialog box.
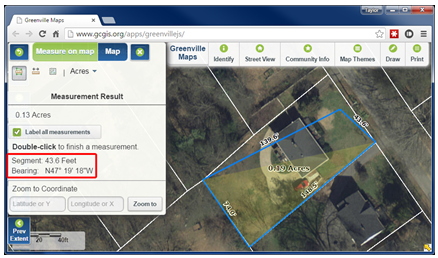
- Double click to finish drawing the measurement polygon.
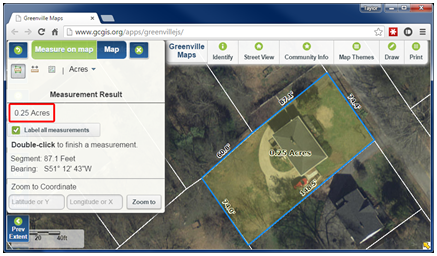
The measurement result will be displayed in the dialog with the appropriate units. Available units of measure are Acres, Square Miles, Square Kilometers, Hectares, Square Yards, Square Feet, and Square Meters.
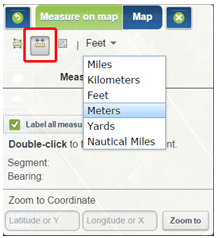
- Select the Distance icon and click Feet to choose the desired unit of measure from the dropdown menu.
- Left click once on the map to start the measurement and left click once for every change in direction. The length and bearing of the current segment
are displayed in the dialog box.
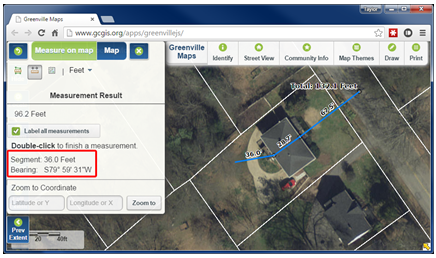
- Double click to finish drawing the measurement line.
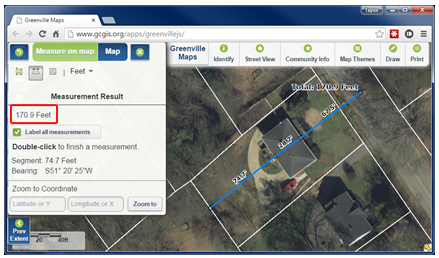
The measurement result will be displayed in the dialog with the appropriate units. Available units of measure are Miles, Kilometers, Feet, Yards, and Nautical Miles.
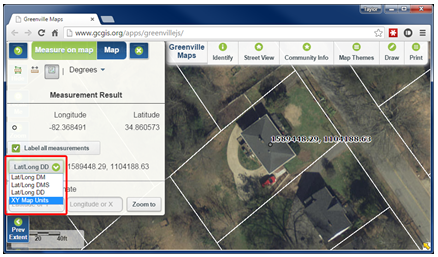
- Select the Location icon and click Degrees to choose the desired coordinate system from the dropdown menu.
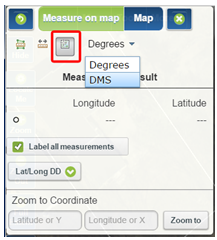
- Left click once on the map and the coordinates will be displayed in the dialog with the appropriate units.
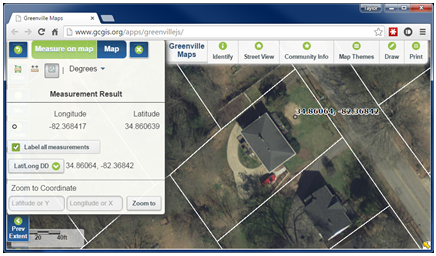
- Other coordinate formats, in addition to the coordinate system chosen above, can be viewed by clicking the Lat/Long DD button in the
dialog box. The coordinate formats include Degrees Minutes, Degrees, Minutes, Seconds, Decimal Degrees, and State Plane.
Note: To clear any measurement graphics in the map view, simply click on one of the measurement icons.
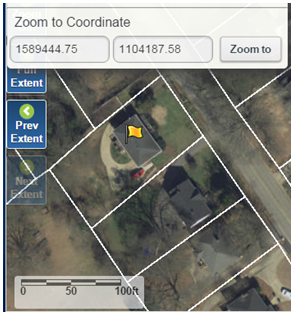
- Optionally, all measurement tools allow you to Zoom to Coordinate if you know the Longitude/Latitude or State Plane coordinates
of a desired location.
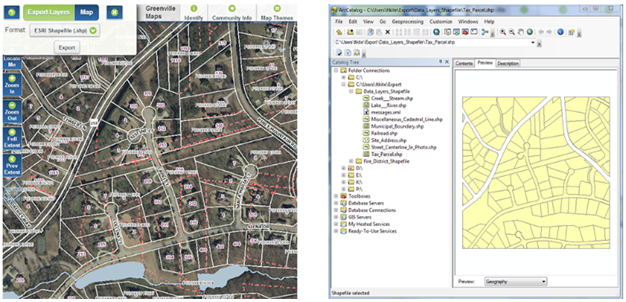
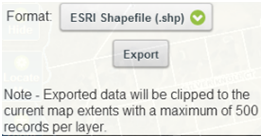
The Export Layers tool provides the ability to export and download most visible data layers within the current map extent (view) as a compressed (.zip) file. To see a list of the layers available for export, as well as the metadata, click here.
The maximum number of features (records) that can be exported is 1000 per data layer.
- Zoom-in to a sufficiently large scale such that the number of features in visible data layers within the map view is less than 1000.
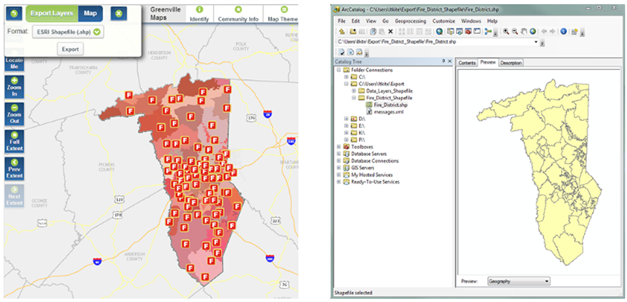
- Click the button labeled ESRI Shapefile (.shp) to choose the appropriate file format.
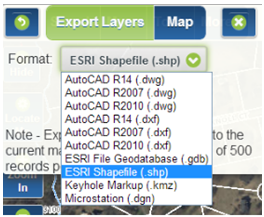
- Click the Export button and wait for export process to finish.
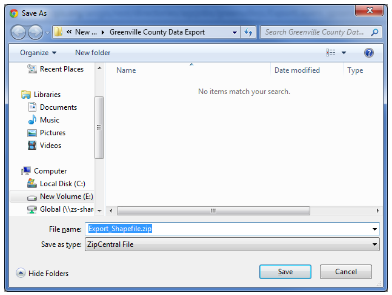
- Choose where to save the zip file and, optionally, name it something recognizable.
- Extract the zip file to a known location.
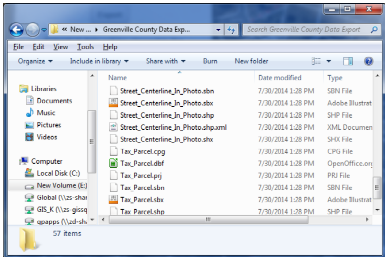
- View files with the appropriate software.
Note: If Pop-up blocking is enabled in your web browser, the file will not download correctly. Ensure that pop-up blockers are disabled, or that pop-ups are allowed for this site.
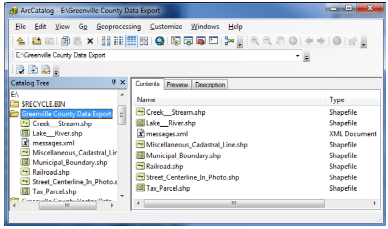
Small scale export example
Countywide Fire Districts with resulting shapefile viewed in ESRI's ArcCatalog.
Large scale export example
Tax Parcels and other data layers with fewer than 1000 features visible in the map. Tax Parcel shapefile viewed in ArcCatalog.