Advanced Internet Mapping System User's Guide
Advanced Internet Mapping System User's Guide
Maps
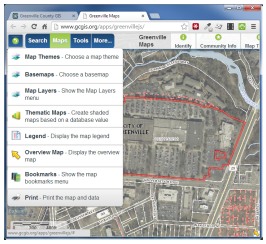
Choose map content, configure display characteristics, book mark areas of interest, toggle map components, and produce output in paper or digital format.
Map Themes -Refresh the map with a group of complementary map layers depicting a topic of interest.
Basemaps - Quickly change the background orthophotography.
Layers - Provides control over map content and display characteristics.
Thematic Maps - Symbolize Tax Parcels based on numeric descriptive data.
Legend - Displays the map legend or key, showing the symbols used to represent the visible map layers.
Overview Map - Toggles a smaller-scale map that shows the limits of the main map's extent with respect to the total surrounding area (typically the Greenville County boundary).
Bookmarks - Provides the ability to create and label shortcuts to areas of interest on the map.
Print - Produces a printable map layout, .pdf, or .jpeg image with optional title descriptive information.
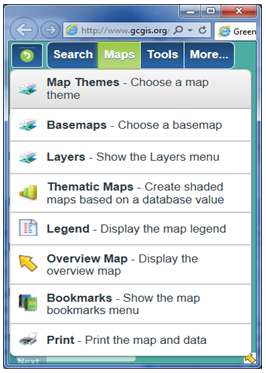
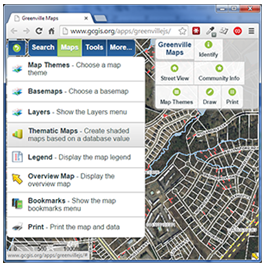
Map Themes displays a group of complementary map layers depicting a topic of interest such as zoning, county council districts, fire districts, FEMA flood zones, etc. To view Map Themes, click on Maps from the main menu and then click Map Themes to display a list of available themes. Alternately, click Map Themes on the quick tools toolbar. Next, click the Map Theme of interest. The default theme is Land Records.
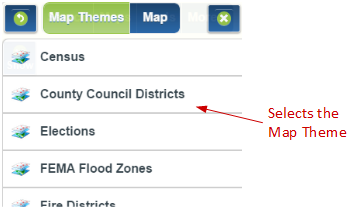
Example
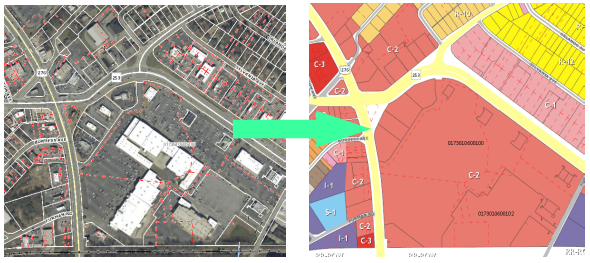
To display zoning polygons and complementary map layers, click on the Zoning map theme.
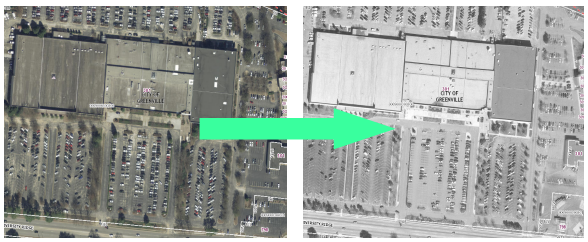
Basemaps quickly changes the background orthophotography displayed in the map. To view Basemaps, click on Maps from the main menu and then click Basemaps to display a list of available basemaps. Next, click on the basemap with the photography of interest. County Basemap is the default and displays the most recent photography.
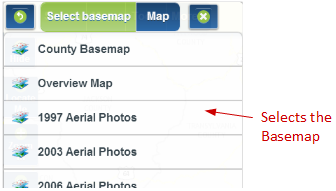
Example
To change the display from the current orthophotography to 1997 orthophotography, click on the 1997 Aerial Photos base map.
The Layers setting provides control over map content and display characteristics. More specifically, layer groups and individual layers may be turned on or off providing more control over map content than using Map Themes. Additionally, layer opacity may be adjusted to highlight or subdue layers within a given service.
Click on Maps and then Layers to display a hierarchical list, grouped by services, by categories (if applicable), and data layers. This example shows a partial list of services.

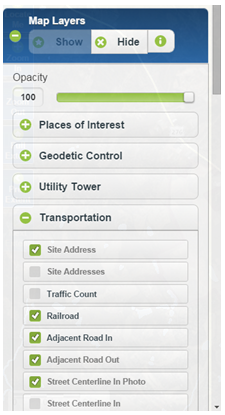
Click the plus icon to expand services and categories. The first example shows the single Municipal Boundary data layer under the Boundary service. The second example shows multiple categories and multiple data layers under each category within the Map Layers service.
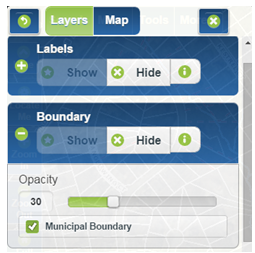
To toggle an entire service on or off, click the Show or Hide button respectively.

To toggle layers on or off, click the check box next to a layer or layers of interest.
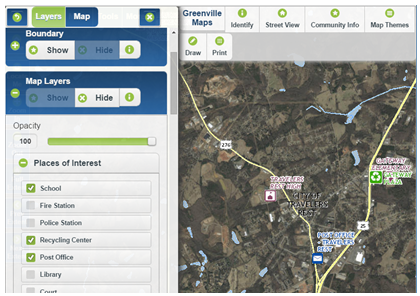
To change the opacity of layers within a service, drag the slider to the desired opacity, 0 being fully transparent and 100 being fully opaque.

Note: The main data categories and layers within the map reside under the Map Layers service.
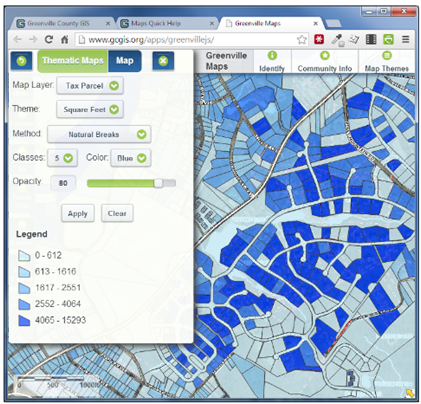
Thematic Maps symbolize Tax Parcels based on numeric descriptive data. More specifically, it creates a shaded Map (Thematic Map) based on a numeric value.
Note: Tax parcels must be visible in the map view to create a thematic map.
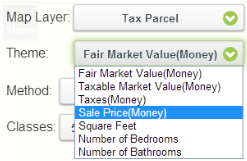
- Navigate to the area of interest and click Maps and then Thematic Maps from the main menu.
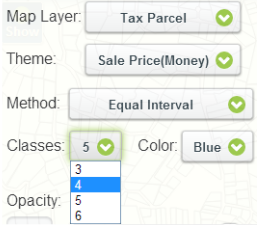
- Click on the Theme dropdown to choose a field to use for symbolization.
- Click on the Method dropdown to choose from available classification methods.
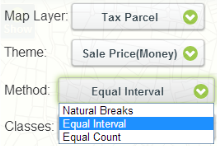
Natural Breaks: Divides a set of attribute values into classes based on natural groups in the data distribution. Natural breaks occur in the histogram at the low points of valleys. Breaks are assigned in the order of the size of the valleys, with the largest valley being assigned the first natural break.
Equal Interval: Divides a set of attribute values into groups that contain an equal range of values.
Equal Count: Divides a set of attribute values so that each has an equal proportion in the data distribution. - Click on the Classes drop down to choose the number of classes represented.
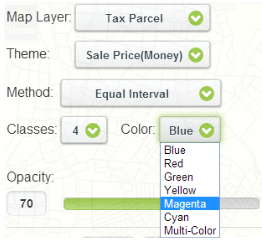
- Click on the Color drop down to choose the map display color.
- Adjust opacity to the desired level by using the slider and note the result.
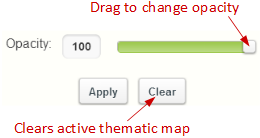
Thematic maps will remain active (symbolized) until the clear button is pressed.
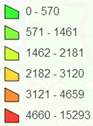
A legend will be available to interpret symbology.
Note: At present only the Tax Parcels map layer is available for thematic maps functionality.
Thematic Map Example
- Map zoomed-in to desired extent.
- Theme set to Square Feet.
- Classification method set to Natural Breaks.
- Number of classes set to five (5).
- Color set to Blue.
- Opacity set to 80%.
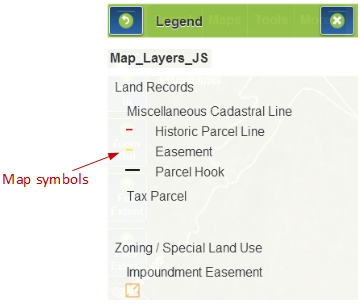
Displays the map legend or key, showing the symbols used to represent the visible map layers.
The Overview Map toggles a smaller-scale map that shows the limits of the main map's extent with respect to the Greenville County boundary.
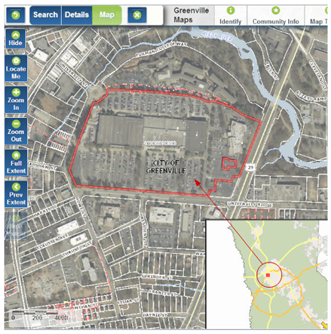
The overview map can also be toggled by clicking on the  icon in the bottom right of the map view.
The main map extent can be changed by dragging the red rectangle in the overview map to a new location.

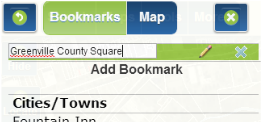
Bookmarks are used to create and label shortcuts to areas of interest on the map.
To add a bookmark:
- Navigate to the area of interest and click Maps and then Bookmarks from the main menu.
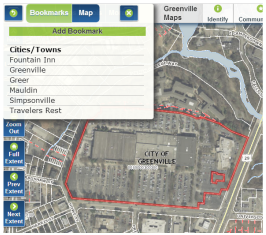
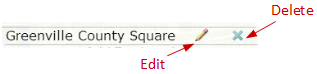
- Click Add Bookmark and type a name into the text box (the default name is Untitled).
- Click on the “pencil” icon to edit the bookmark or click the “X” icon to delete the bookmark.
Bookmarks are stored in browser cookies and will persist until browser cookies are cleared. Depending on the browser used and how browser history is managed, bookmarks may or may not persist from one session to another.
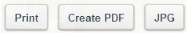
The Print function is used to produce a printable map layout or an image in PDF or JPEG format with a title and optional descriptive information.
To create a printable map:
- Navigate to the area of interest and click Maps and then Print from the main menu or click
Print on the quick tools toolbar.
- An orange graphic showing the extent of the print area will display.
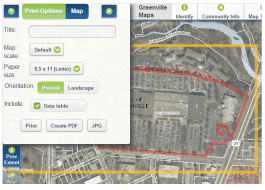
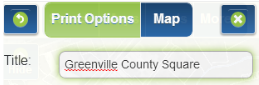
- Optionally, enter a title for the map.
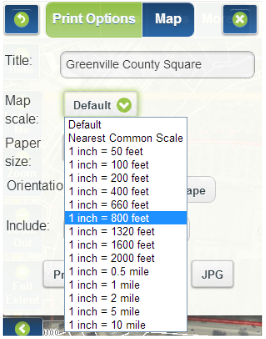
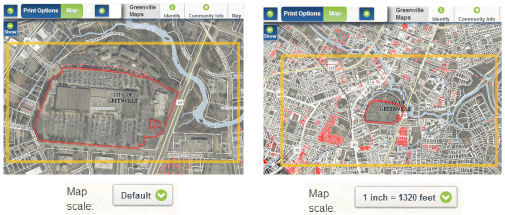
- Optionally, set a map scale. Map scale is initially set to Default. This setting will print the map at the largest scale
possible for a given page size. To set a scale other than the default, choose the desired scale from the drop-down menu.
When a new scale is selected, the orange bounding rectangle and the map extents will change to reflect the new printable area.
Example
- The default paper size is 8.5” x 11”. Click on the drop-down to select an alternative paper size from the list.
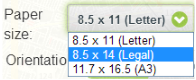
- To change the default page orientation from Portrait to Landscape, click the appropriate Orientation button.

Data Table:
If a feature is selected, an option to include the data table will be available. This option is not available when creating a .pdf or .jpg.
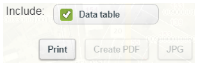
If the Data Table checkbox is checked, the feature information (attributes) will be included in the printable map. However, it is recommended to leave this option unchecked, as it reduces the printable map size dramatically. If descriptive (attribute) information is required, export to a comma separated values (.csv) file for Excel or create a Property Report for a Tax Parcel.

Optionally, create a .pdf or .jpeg image of the map.